
Federated Query Execution Plans
Open any query run and see exactly what was pushed down to each source, what each step really returned, and how the results were joined.
These images are illustrations of the concept, not screenshots of the actual product.
Overview
Federation makes one question span several systems, which is exactly what makes a slow or surprising answer hard to explain. Was the filter applied at the source or after the rows arrived? Did an aggregation run remotely or in memory? How many rows did the planner expect, and how many actually came back? This concept answers those questions for a single run, in one page reached from the Query Console.
The illustrated run detail is headed by a short run identifier and a success badge, with a line beneath naming the saved query and the version of the model it resolved against. Four cards summarize the outcome in sample figures: rows returned, wall-clock duration, the number of sources touched and an estimated cost expressed as time. Together they give the shape of the run before anything technical is read.
The Execution Plan panel is the heart of the page. Each step is a card naming the entity it read and the source and connector it read from. Inside the card, the plan is made explicit: which predicates were pushed to the source, how many columns the projection was narrowed to, and whether an aggregation was pushed down as well. A second row of figures compares estimated rows against actual rows and reports the step's duration, so the gap between what the planner assumed and what the source delivered is visible rather than inferred. In the sample run, one step carries pushed filters, a trimmed projection and a pushed sum while the other pushes no predicates at all and reads a small dimension exactly as estimated. A join order strip below the steps shows which side led the join.
A Plan Summary panel on the right condenses the run into the facts an engineer reaches for first: the planner engine version, the driving entity, the number of joins, bytes processed, and whether the result was served from cache. That cache line is the hinge between this concept and performance tuning, since a run that never hits cache is exactly the kind of run the tuning proposals learn from. A note in the same panel reports whether row and column access policies were evaluated for the run, so plan reading and access control sit side by side.
What this concept shows
- A run header with a status badge, the saved query name and the model version it resolved against
- Summary cards for rows returned, duration, sources touched and an estimated cost expressed as time
- Per-step plan cards naming the entity read and the source and connector behind it
- Pushed predicates, pushed projection column counts and pushed aggregations shown per step
- Estimated rows compared against actual rows, so planner assumptions can be checked
- A per-step duration that shows where the run's time actually went
- A join order strip showing which entity led the join
- A plan summary with engine version, driving entity, join count, bytes processed and cache status
How it works
- Open the Query Console and select a saved query.
- Choose a specific run from its history to open the run detail.
- Read the summary cards for rows, duration, sources touched and estimated cost.
- Work through each plan step to see which predicates, projections and aggregations reached the source.
- Compare estimated against actual rows and per-step duration to find the expensive step.
- Check the join order and the plan summary, including whether the result came from cache.
- Carry what you learn into model changes or the tuning proposals for the busiest queries.
Who it's for
- Analytics engineers
- Data platform engineers
- Query authors tuning slow reports
- Data architects reviewing federation behavior
Illustrations
1 illustration of this concept. Select one to view it full size.
Query Run Detail With Execution Plan
A desktop layout with the product's left navigation, Query Console selected, and a breadcrumb from the console through a saved query to a single run. The heading pairs a short run identifier with a success badge, above a line naming the query and the model version it used. Four cards report sample figures for rows returned, duration, sources touched and estimated cost expressed as time. An Execution Plan panel holds two step cards, each naming an entity and the database source and connector behind it, and listing pushed predicates, pushed projection columns, any pushed aggregation, estimated rows, actual rows and step duration. One step pushes filters and a sum; the other pushes no predicates and returns exactly the estimated row count. A join order strip shows which entity led. A plan summary panel lists engine version, driving entity, join count, bytes processed and cache status, above a note on access policy evaluation.
Topics
- federated query execution plan
- predicate push-down
- projection push-down
- query plan explain
- estimated vs actual rows
- join order analysis
- cross source query performance
- bytes processed per query
- query run history detail
Related concepts
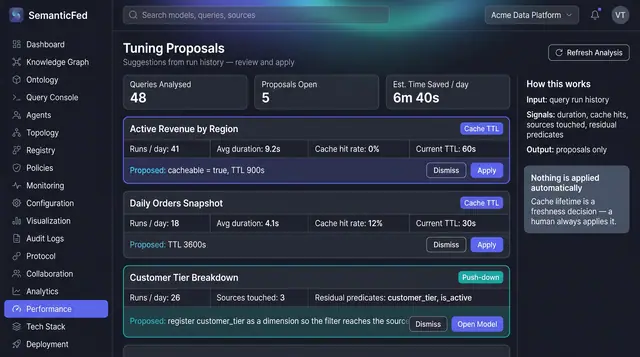
Cache and Push-Down Tuning Proposals
Read query run history back as concrete proposals: cache a query that never hits cache, or push a lingering filter down to the source.
1 illustration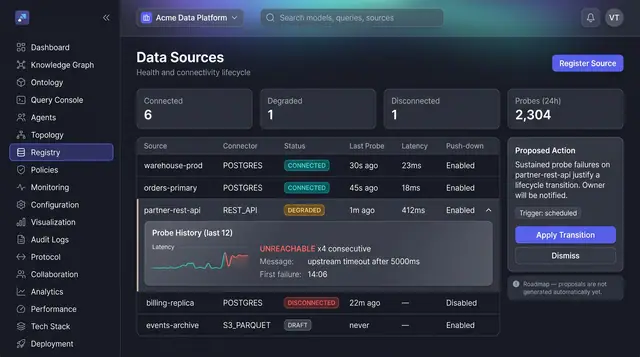
Source Health and Lifecycle Triage
See every registered source's health at a glance, open the probe history behind a failure, and act on a proposed lifecycle transition.
1 illustration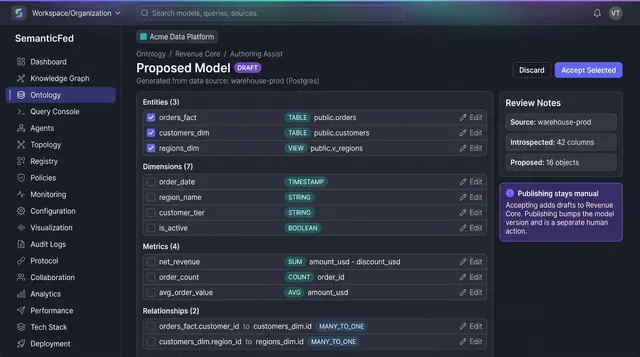
AI-Assisted Model Authoring
Turn an introspected source schema into a proposed draft of entities, dimensions, metrics and relationships, then accept only what fits.
1 illustration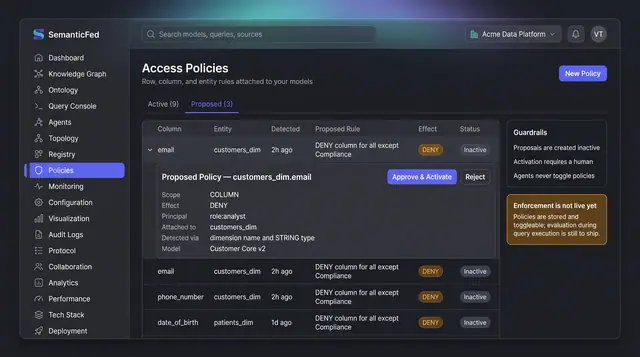
PII Access Policy Proposals
Sensitive columns are surfaced as inactive policy proposals with their detection reasoning, and only a person can approve and activate them.
1 illustration